
DuckDB
Working as an integration engineer has taught me a lot about systems and design. Once the product you work on matures, there will inevitably be requirements to integrate with third-party systems.
One of the most challenging aspects, in my experience, is designing the architecture for integration, only to find that new third-party systems don’t fully align with your design. You have to deal with a wide range of technologies, API rate limits, and unnoticed data changes that can break your inbound and outbound flows.
That’s why monitoring the integration system is a key process. I didn’t do this as often as I should, and there were also limitations in the resources I could work with to build an effective monitoring setup.
Third-party systems fail too. Sometimes they send bad data. If the volume is acceptable, we might ignore it. But how do you measure that volume? You need the right database to analyze and visualize historical data.
Meet DuckDB
DuckDB is an analytical database that supports SQL. It follows the same philosophy as SQLite — simple installation and embedded in-process operation — which is what made SQLite the world’s most widely deployed DBMS.
Our integration data source is PostgreSQL. While it’s great for transactional workloads, analytics isn’t its strong suit. So, I run a Dagster workflow that streams selected column data from PostgreSQL. I can create different streams on the same PostgreSQL table, each with different columns for different reports.
For visualization, I use Grafana with an unofficial plugin: https://github.com/motherduckdb/grafana-duckdb-datasource. Setting it up is fairly straightforward. One drawback, though, is that you need two copies of the DuckDB database — one for streaming and one for visualization. This setup is fine until the database grows too large, and the streaming and copying processes start to degrade in performance. I’ll talk about optimization later.
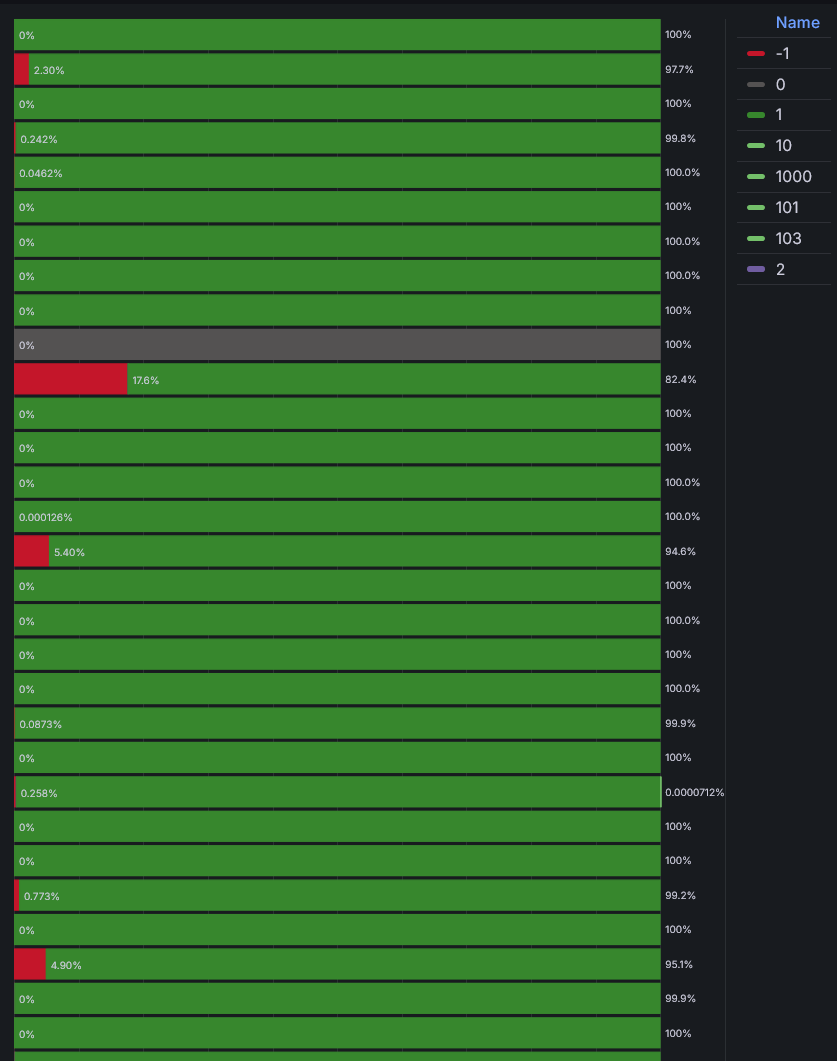
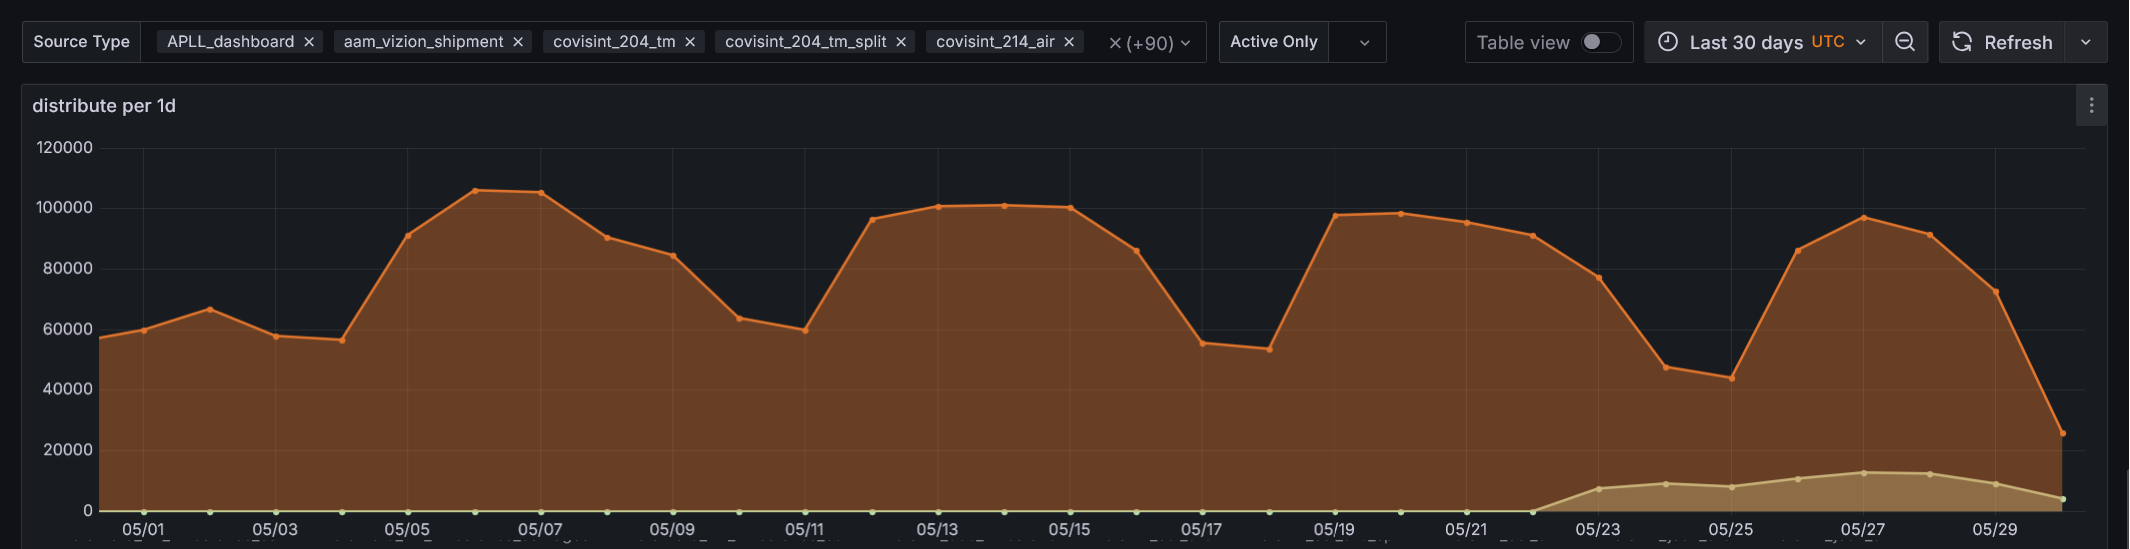
The common reports (Grafana panels) I use are:
- A bar chart showing counts of processed statuses per third party (1st image).
- A table listing error types, counts, and last-seen times per third party. The raw error data often contains unique IDs that create duplicate entries for the same error. My best solution so far is to extract filenames and line numbers and hash them. This allows me to group errors with the same hash into a single error type (I think Sentry uses a similar approach).
- A time series chart showing status counts over time per third party (2nd image).
A cool trick I learned: using the PIVOT statement to reshape data into the correct format
required by certain Grafana visualizations.
The Challenge
As mentioned earlier, I faced some performance issues. Here’s how I optimized the system:
- I split the DuckDB database into monthly partitions (shards).
- I used
UNION ALLinstead ofUNIONin Grafana queries. Initially, I forgot thatUNIONremoves duplicates and is slower, whereasUNION ALLis faster. - Even querying directly from the shards wasn’t fast enough — I still encountered
context deadline exceedederrors. To improve performance, I started exporting the data to Parquet files (which DuckDB can do very efficiently in most cases), and then queried those files instead. Luckily, Grafana supports multiple queries per panel, so this setup works well. - For error processing, I originally used Python user-defined functions (UDFs) in DuckDB, which were convenient but slow on larger datasets. To improve performance, I ported the UDF logic to Rust using PyO3, which significantly reduced processing time while maintaining integration with DuckDB.
More Fancy Stuff
There’s a DuckDB extension for PostgreSQL: https://github.com/duckdb/pg_duckdb. From what I understand, it allows you to run analytical queries directly within PostgreSQL. Since I don’t manage our PostgreSQL instance, I haven’t had the chance to try it out — but I’d love to explore it one day.